


BUSINESSES SHOULD PROVIDE GOODS AND SERVICES IN A MANNER THAT IS SUSTAINABLE AND SAFE
Innovation is at the heart of our ambition to grow sustainably. By combining key consumer insights with cutting-edge science and technology, we develop products that improve lives while positively impacting the environment and society. Our comprehensive portfolio of projects focuses on breakthrough technologies and responding to consumer demands, making our products more sustainable. We leverage advanced digital technology and data to deliver extraordinary products, services, and experiences. With world-class R&D centers and a strong tradition of research, we aim to innovate boldly for people and the planet.
Message from Our
Leadership
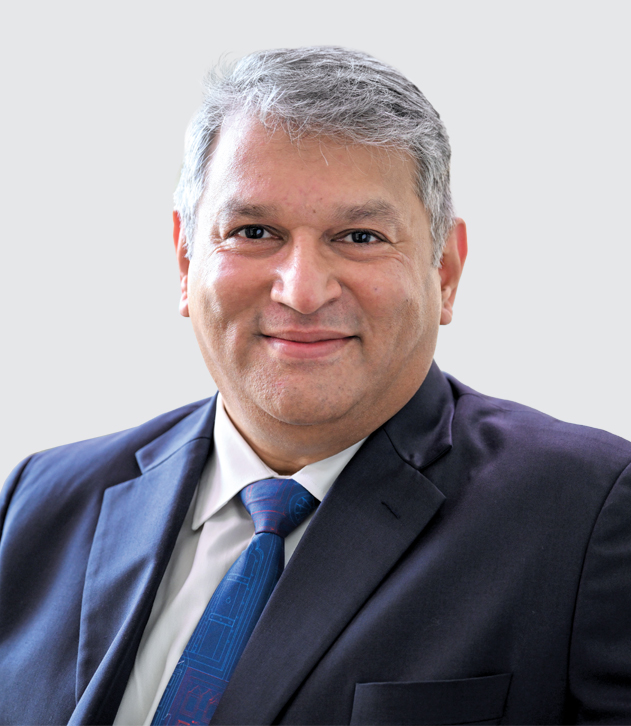
"Our strategy is centred on disruptive, technology-led, and consumer-centric innovation interlocked with sustainability - transforming the way we deliver value. While we leverage advanced digital and AI capabilities to drive speed and agility, we are also harnessing the power of nature and science to develop next-generation materials and technologies that are beneficial for both people and planet. This ensures we not only meet current demands but also pave the way for an exciting sustainable future.”
Vibhav Sanzgiri Executive Director, Research and Development
0%
R&D Investments in technologies to improve the environmental and social impacts of product and processes
0%
Recycled plastic procured as a % of total plastic footprint in finished goods sold
0%
Capex Investments in technologies to improve the environmental and social impacts of product and processes
0%
Key crops sustainably sourced
Essential Indicators
EI-1. Percentage of R&D and capital expenditure (CAPEX) investments in specific technologies to improve the environmental and social impacts of product and processes to total R&D and CAPEX investments made by the entity, respectively.
| Category | FY 2024-25 | FY 2023-24 | Details of improvements in environmental and social impacts |
|---|---|---|---|
| R&D | 13.2%* | 9.5%* |
Throughout the year, we focused on research and
development for sustainability projects across different
business groups. Our efforts included incorporating post-consumer
recycled (PCR) materials, reducing the use of virgin
plastics, cutting greenhouse gas (GHG) emissions, reducing
sugar content, and transitioning to plant-based materials. Our R&D sites also worked on improving processes and capabilities thus enhancing safety, conserving water, managing waste, and promoting employee health and wellbeing. |
| CAPEX | 13.6% | 25.0% | During the year, we have undertaken capital expenditure on various projects like upgrading infrastructure, implementing energy-efficient systems like magnetic chillers and heat pumps, improving safety measures, automating processes, and ensuring compliance with statutory requirements, all to deliver positive outcomes for environmental and social aspects. |
*In addition to this, we benefit from the extensive R&D work undertaken by the Unilever Group through the technology licensing arrangement. Projects having positive environmental and social impact of R&D undertaken by the parent company will be over and above the reported numbers
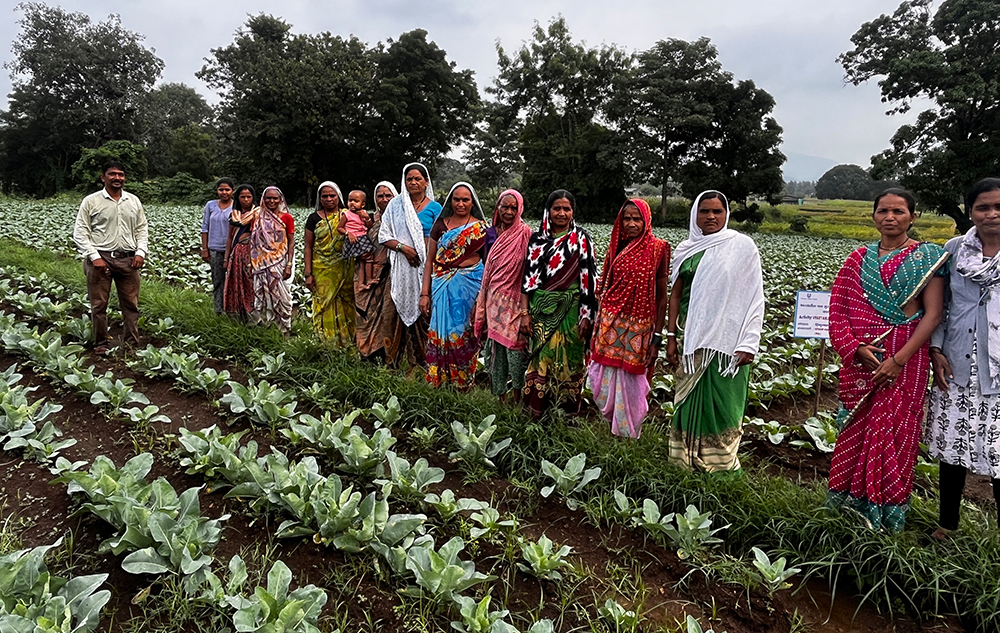
EI-2. a. Does the entity have procedures in place for sustainable sourcing? (Yes/No)
Yes, our Responsible
Partner Policy (RPP) outlines mandatory supplier requirements for ethical and
sustainable business
practices. It reflects our commitment to responsible, transparent, and sustainable
operations, central to our core
sustainable business strategy. In addition to RPP, The Unilever Sustainable
Agriculture Principle (SAP) and the Unilever
Regenerative Agriculture Principles (RAPs) also provide the basis for our
sustainable sourcing programme. The Unilever
Sustainable Agriculture Principle (SAP) presents best practices for farming,
utilised by hundreds of thousands of farmers
since 2010 for sustainable operations and Unilever Regenerative Agriculture
Principles guide soil nourishment, carbon
capture, and land restoration. These principles inspire our business, brands,
suppliers, and peers, forming the foundation
for regenerative programs in our supply chain.
In our revised Sustainable Sourcing programme, we concentrate on 12 key
crops and agricultural commodities, prioritizing
their significance to our business and brands.
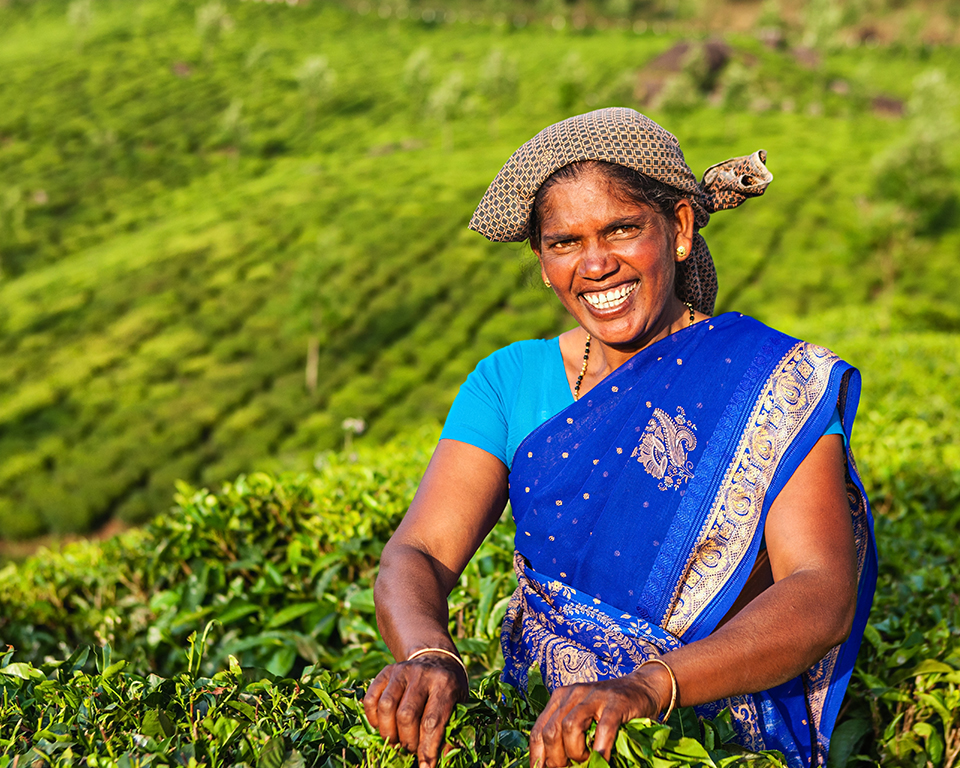
We believe that certification is one of the vital ways to drive positive change in
agricultural supply chains. We are India’s
largest tea business and a founding member of trustea (Link), the Indian tea
industry collaboration
on sustainability.
The RPP and Sustainable Agriculture Principle and Regenerative Agriculture
Principles (RAPs) are hosted on our website at Link
EI-2. b. If yes, what percentage of inputs were sourced sustainably?
58.2%* of
key crops were sourced sustainably.
These crops include tea, palm oil, paper and board,
cereal, sugar, dairy, cocoa, coconut oil, soy, starches,
and vegetables & herbs, comprising more than two-third
of our agricultural raw material volumes. Through
focused programmes, we have achieved sustainable
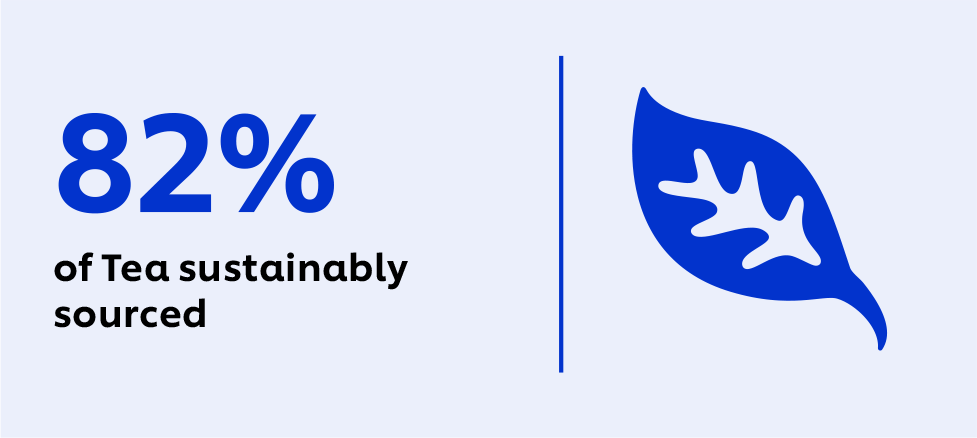
sourcing for 96% of our paper and board, 77% of our
tomatoes and 82% of our tea procured during the
calendar year 2024.
EI-3. Describe the processes in place to safely reclaim your products for reusing, recycling, and disposing at the end of life, for (a) Plastics (including packaging) (b) E-waste (c) Hazardous waste and (d) other waste.
There are mainly two categories of material that are reclaimed:
a) Damaged and expired finished goods: There is a comprehensive standard operating procedure (SOP) for safely handling and disposing of expired/ damaged stocks returned from the market and depots. These goods are either safely disposed of or recycled or reused.
b) Plastic waste as part of Extended Producer Responsibility (EPR): We follow the new national EPR Framework notified by CPCB that has become operational since Apr 2023 wherein an EPR wallet credit system has been created by CPCB. We undertake EPR credit purchases based on our plastic footprint / consumption and fully meet the EPR obligation.
EI-4. Whether Extended Producer Responsibility (EPR) is applicable to the entity’s activities (Yes/No). If yes, whether the waste collection plan is in line with the Extended Producer Responsibility (EPR) plan submitted to Pollution Control Boards? If not, provide steps taken to address the same.
Yes, Extended Producer Responsibility (EPR) is applicable to HUL, and we comply with the prevailing EPR rules and regulations. Our waste collection plan aligns with the EPR guidelines and the plan submitted to the Central Pollution Control Board (CPCB). W.e.f. FY 2023-24, we have been registered on the CPCB online portal dedicated to EPR Credit exchange and ensure timely submissions of our plastic footprint and corresponding EPR credits purchased.
LEADERSHIP INDICATORS
LI-1. Has the entity conducted Life Cycle Perspective/Assessments (LCA) for any of its products (for manufacturing industry) or for its services (for service industry)? If yes, provide details in the following format?
Life Cycle Assessments (LCAs) of our products are
conducted by our Parent Company (Unilever PLC), either
internally with in-house LCA experts or by external
partners and in compliance with ISO 14040. Unilever
applies internationally accepted impact assessment
methods, such as the IPCC 2021 GWP100, ReCiPe and the
European Commission’s Environmental Footprint (EF) for
quantifying the environmental impacts of a product – from
the sourcing of raw materials to product manufacture,
distribution, consumer use and disposal.
Unilever conducts an annual GHG footprinting (i.e., LCA
focused on climate change impact category) exercise for
representative products across 13 countries, including
India. The methodology is consistent with ISO 14040.
Additionally, each year, Unilever assesses its corporate
GHG emissions through a corporate LCA focused on
climate change, using a top-down approach (utilising
material flow analysis - MFA) enabling reporting on its
mid-term 2030 SBTi targets and its 2039 Net Zero target.
| Name of Product/ Service | All major brands across Home Care, Beauty & Wellbeing, Personal Care, Foods and Refreshments |
| % of total Turnover contributed | 76.7% |
|---|---|
| Boundary for which the Life Cycle Perspective/Assessment was conducted | Cradle-to-grave LCA focused on climate change was conducted to assess GHG emissions over the entire life cycle of the products, from raw material extraction to final disposal |
| Whether conducted by independent external agency (Yes/No) | Assessment was conducted by internal agency (Safety, Environmental & Regulatory Sciences) |
| Results communicated in public domain (Yes/No) If yes, provide the web-link. | Results are currently not communicated in the public domain |
In 2022, LCA was used to understand the key challenges
to achieve our Net Zero target for all our products from
sourcing to point of sale. A key area of focus was the raw
materials footprint, which is related to the emissions from our suppliers. We also
included the impact of
packaging, inbound and outbound logistics (including
retail-related emissions) and disposal of the products
(post-consumer use, i.e., biodegradation of chemicals and
treatment of packaging).
In 2024, Unilever commissioned an annual LCA model
representing its palm oil sourcing, and HUL together with
the Indian Tea Research Association (TRA) commissioned
an LCA of tea production in India.
Unilever has provided funding towards development of
the World Foods Life Cycle Database, and is still among
the key users and partners of this initiative, owned and
managed by an external LCA consultancy. Unilever is a
sponsor of the United Nations Environment Programme
(UNEP) Life Cycle Initiative (LCI), which aims to support the
application of LCA for policy and wider decision-making.
LI-2. If there are any significant social or environmental concerns and/or risks arising from production or disposal of your products/services, as identified in the Life Cycle Perspective/Assessments (LCA) or through any other means, briefly describe the same along-with action taken to mitigate the same.
We have conducted a detailed analysis to identify inherent
ESG risks for our business, considering issues significant
to our stakeholders. And the key risks identified, inter alia,
are climate change, waste management, resource use
and circularity, biodiversity and ecosystem health and
water scarcity and use. Our Life Cycle Assessments have
highlighted Scope 3 emissions as a notable factor in our
overall emissions footprint.
Raw material sourcing and production represents a
significant contribution to the total life cycle impact of
our products. The GHG emissions from the production of
our key forest-risk commodities (i.e. palm oil, paper and
board, tea, soy and cocoa) arise from land use change (e.g. deforestation),
agricultural practices and downstream
processing and hence our focus is on using non-deforestation
materials – including in the case of palm, for
example, NDP (No deforestation, no use of peat land).
Aligned with Unilever’s climate action transition plan to
achieve net zero across our value chain by 2039, we are working
closely with our supplier partners, industry associations,
regulatory bodies, and the government to foster a supportive
ecosystem and implement the necessary changes.
Ingredients in our
products contribute a significant portion
to our scope 3 emissions and is completely dependent on
external partners. Keeping that in mind we hosted ‘Clean
Future Summit’ in August 2023 to foster industry-wide
commitments on sustainable practices around emissions
across the value chain. During this event we also revealed
the results of successful scale up of low greenhouse
gas emitting soda in partnership with Tuticorin Alkali
Chemicals and Fertilizers Limited. We have made progress
since then and are now sourcing a significant portion of
our Soda Ash requirements from Low GHG sources.
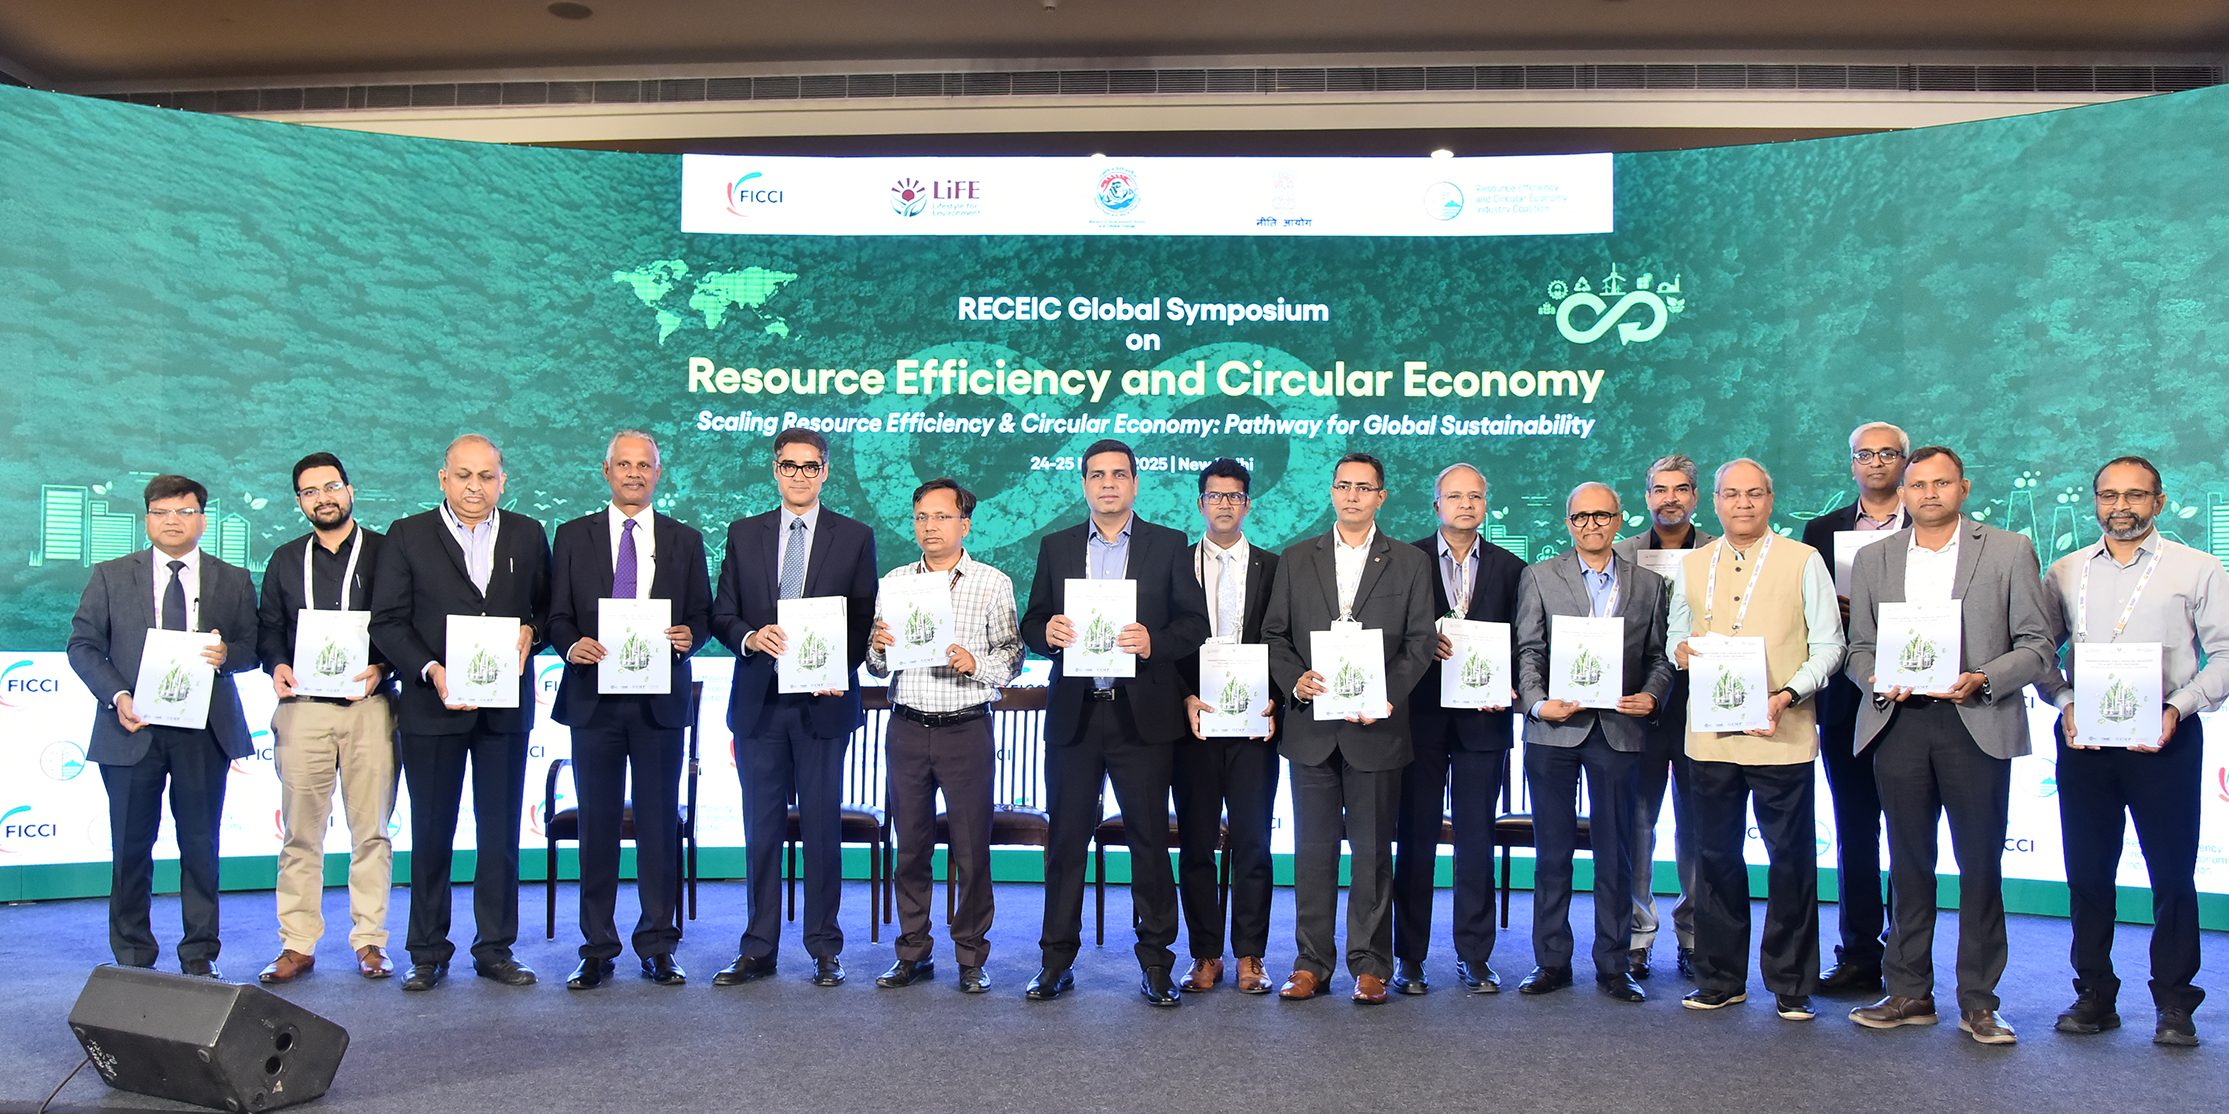
To achieve net zero across our value chain, we need
industry and government alignment and action. To
enable this, we have secured founding membership of
the Resource Efficiency and Circular Economy Industry
Coalition (RECEIC); launched under India’s G20 Presidency
in 2023. FICCI acts as the secretariat for RECEIC. Within this
Unilever is chairing a working group “Material Transition
for the Chemical Industry”. Through this platform, we are
collaborating with chemical industry partners across
value chain to recommend suitable policies and measures
to the government for enabling materials transition from
current fossil-based ingredients to renewable ingredients.
The Company has partnered with the Federation of
Indian Chambers of Commerce and Industry (FICCI) to
launch the Centre for Sustainability Leadership (CSL). The
ambition of CSL is to help accelerate the Indian corporate
sector’s climate action by institutionalising sustainability
leadership across FICCI members. In 2024, HSBC has
partnered with the centre as a co-founder.
Sustainable Palm
Soap bars typically comprising more
than 80% soap
molecules (>70% TFM - Total Fatty Matter) account
for a large part of the palm footprint in non-edible
usage. Ensuring availability and managing the
environmental impacts of increased oil consumption are
challenges faced by the soap industry today. Our R&D is
committed to and has developed novel and proprietary
technologies to manufacture soap bars that meet the
desired functionality, while reducing the palm footprint
significantly, and helping address climate change
through lowering greenhouse gas emissions and the
carbon footprint of our products. Further, from a consumer
point of view, these products allow for better affordability,
beauty and hygiene benefits, and sensory properties,
which are desired by consumers. For example, we have
implemented ‘Stratos Technology,’ which not only uses
more sustainable palm oil but also enhances the efficacy
of our soap bars. By incorporating benefit agents like
plant polysaccharides, natural fatty acids, and vitamins,
this technology reduces Total Fatty Matter (TFM) by upto
25%, decreases GHG emissions across the value chain,
and delivers superior products to our consumers. We have
received the prestigious Skin Health Alliance accreditation
on Lux and also multiple accolades at the IPHA conference
for the hygiene benefits of this technology.
Additionally, we have acquired a palm undertaking in
Telangana as part of our palm localization strategy. This
backward integration will help build a resilient supply
chain for palm derivatives, ensuring sustainable practices,
reducing import dependency, and supporting the local
value chain. This initiative aligns with the National Mission
on Edible Oils, which aims to boost domestic production
and reduce reliance on imports.
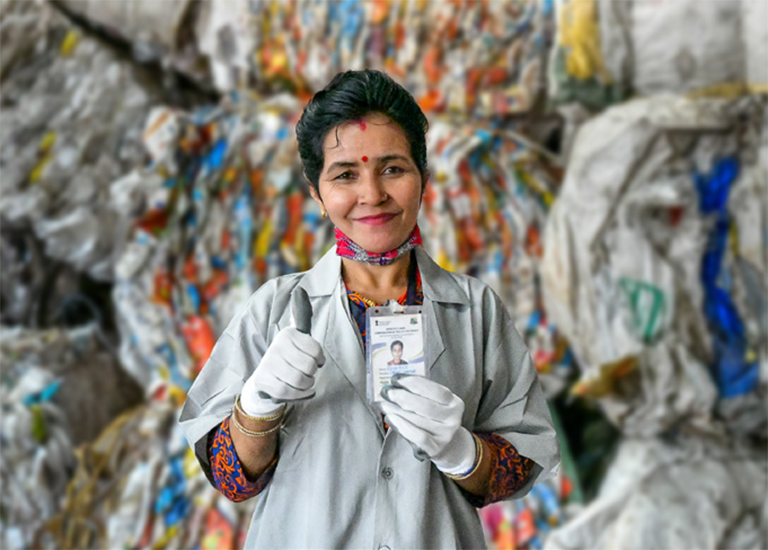
Plastic Circularity
We are rethinking innovative solutions to
redesign our
packaging by cutting down the use of virgin plastic
and replacing by post-consumer recycled (PCR) resins Link.
Over the past five years, we have been at the
forefront fostering recyclers, nurturing startups, and
championing sustainable practices. In a groundbreaking
collaboration with Banyan Nation, we achieved a
significant milestone by incorporating PCR into shampoo
bottles for the first time and since then have been
expanding PCR inclusion across all Brands. As one of
the early adopters, we have incorporated recycled
plastic into our packaged food business following
the r-PET regulation unlock (e.g., Kissan Squash).
We have also announced acquisition of stake in recycled
flexible plastics firm Lucro Plastecycle Private Limited,
taking ahead our partnership. With their expertise
in flexibles, we were able to pioneer PCR in flexibles
packaging. These collaborative approaches not only
mark pivotal moments in sustainable packaging but
also promotes the growth of its supply chain partners
and fosters innovation within the industry. Over 25 of
our brands use PCR, to name a few like Vim Dishwash,
Surf excel, Comfort, Vaseline, Dove, Sunsilk etc.
To sustain the transitions from non-recyclable to
recyclable design, practical and cost-efficient solutions
are imperative. Our strategy to achieve cost-efficient
solution are effective e-tendering, developing alternate
feedstock suppliers and convertors, one structure to
achieve scale benefit and digitization.
LI-3. Percentage of recycled or reused input material to total material (by value) used in production (for manufacturing industry) or providing services (for service industry).
Plastic packaging needs to be recycled in environmentally friendly ways to build a circular economy. We have set ambitious targets to ramp up the use of recycled plastic and only use reusable, recyclable or compostable plastic packaging (Link).
| Indicate input material | Recycled or re-used input material to total material | |
|---|---|---|
| FY 2024-25 | FY 2023-24 | |
| Plastic packaging | 6.1%* | 4.4%* |
*% of recycled plastic as post-consumer recycled plastic procured on a base of total plastic footprint in the finished goods sold during the financial year
LI-4. Of the products and packaging reclaimed at end of life of products, amount (in metric tonnes) reused, recycled, and safely disposed, as per the following format:
| Product | FY 2024–25 | FY 2023–24 | ||||
|---|---|---|---|---|---|---|
| Re-used | Recycled | Safely disposed | Re-used | Recycled | Safely disposed | |
| Plastics (including packaging) (MT)* | - | - | 2,07,005** | - | - | 88,294** |
| E-waste | - | - | - | - | - | - |
| Hazardous waste | - | - | - | - | - | - |
| Other waste – Expired and damaged products (MT) | 1,549 | 682 | 6,380 | 1,909 | 539 | 6,352 |
* Since April 2023, EPR for
Plastics is carried out by purchase of EPR credits from Plastic Waste Processors
(PWPs) via portal maintained by Central
Pollution Control Board (CPCB), in line with applicable guidelines. HUL is not
collecting any branded plastic waste directly. On-ground plastic waste
collection & disposal is carried out by PWPs authorised & monitored by CPCB/ State
Pollution Control Board (SPCB)
**A part of the safely disposed plastic is also
recycled, however, due to practical difficulties in traceability of such recycled
plastics, the entire quantum
is reported as safely disposed
LI-5. Reclaimed products and their packaging materials (as percentage of products sold) for each product category.
| S. No. |
Indicate product category | Reclaimed products and their packaging materials as % of total products sold in respective category |
|---|---|---|
| 1 | Expired and damaged products (Depot and Market Return) | 0.2% |
| 2 | Plastic waste | 165.8% of total plastic packaging material* |
* HUL is committed to fulfilling its plastic waste management EPR obligations as mandated by the government. We actively pursue EPR credits to meet our commitment of purchasing EPR credits equal to 100% of the plastics used in our products. In FY2023-24, we received 88,294 tons of actual credits, covering 72.2% of our total plastic packaging material. This shortfall was due to a temporary system glitch on the CPCB’s EPR portal. Consequently, the pending credits from the previous financial year, were credited in addition to this financial year’s requirement