


Businesses should provide goods and services in a manner that is sustainable and safe
When the planet thrives, so do we. The only way to grow our business is to help address the climate crisis by protecting and restoring our natural environment. We envision a world where forests are safeguarded, agricultural systems are rejuvenated, water systems are preserved, and smallholder farmers are empowered. At Hindustan Unilever, we aim to build a planet-positive future through our supply chain and beyond by regenerating the land, forests, and water systems we depend on.
Message from Our
Leadership
“As pioneers in the Indian FMCG industry, we are dedicated to embracing safe, superior, and low/net zero-carbon technologies. These technologies are integral in our efforts to design, manufacture, procure and supply goods and services to our constantly evolving consumer base, while delighting them with sensorials and benefits, and actively addressing environmental challenges.”
Vibhav Sanzgiri Executive Director, Research and Development
9.5%
R&D Investments in technologies to improve the environmental and social impacts of product and processes
0%
Recycled plastic procured as a % of total plastic footprint in finished goods sold
0%
Capex Investments in technologies to improve the environmental and social impacts of product and processes
0%
Key crops sustainably
sourced
Essential Indicators
EI-1. Percentage of R&D and capital expenditure (CAPEX) investments in specific technologies to improve the environmental and social impacts of product and processes to total R&D and CAPEX investments made by the entity, respectively.
| Category | FY 2023-24 | FY 2022-23 | Details of improvements in environmental and social impacts |
|---|---|---|---|
| R&D | 9.5%* | 8.1%* | During the year, we have undertaken research and development on various sustainability projects like Deforestation Free Palm, replacing non-recyclable plastics with recyclable plastics and GHG reduction through eco-design projects. Apart from these projects, we work towards water conservation, energy conservation, social responsibility under the PwD, employee well-being, and waste management. |
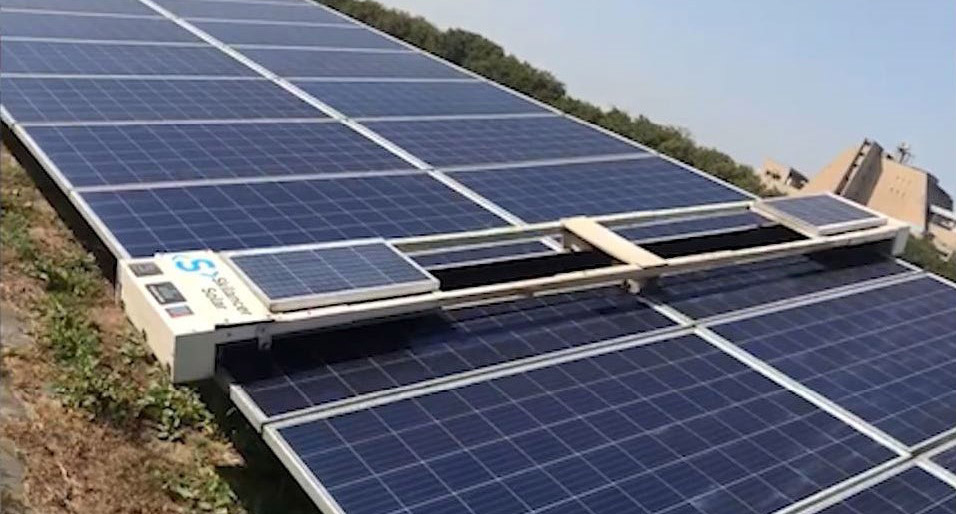
| CAPEX | 25.0% | 13.0% | During the year, we have undertaken capital expenditure on various sustainability projects like setting up machinery to replace palm fatty acids with starch, heat pump for hot water application, magnetic chiller for chiller application, enhancement of solar plant & windmill footprint, water conservation & harvesting, and occupational health & safety improvement programmes. |
*In addition to this, we benefit from the extensive R&D work undertaken by the Unilever Group through the technology licensing arrangement. Projects having positive environmental and social impact of R&D undertaken by the parent company will be over and above the reported numbers.
R&D and CAPEX investments (%)
EI-2. A. Does the entity have procedures in place for sustainable sourcing? (Yes/No)
Yes, our Responsible Partner Policy (RPP) outlines
mandatory supplier requirements for ethical and
sustainable business practices. It reflects our commitment
to responsible, transparent, and sustainable operations,
central to our core sustainable business strategy. In addition
to RPP, The Unilever Sustainable Agriculture Code (SAC) and
the Unilever Regenerative Agriculture Principles (RAPs) also
provide the basis for our sustainable sourcing programme.
The Unilever Sustainable Agriculture Code (SAC) presents
best practices for farming, utilised by hundreds of
thousands of farmers since 2010 for sustainable operations
and Unilever Regenerative Agriculture Principles guide
soil nourishment, carbon capture, and land restoration.
These principles inspire our business, brands, suppliers,
and peers, forming the foundation for regenerative
programmes in our supply chain.
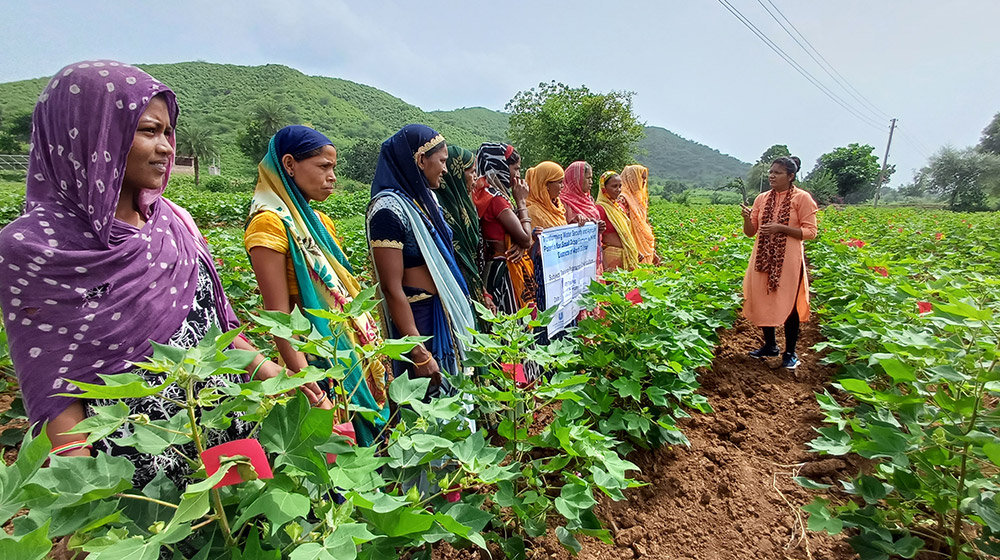
In our revised Sustainable Sourcing programme, we
concentrate on 12 key crops and agricultural commodities,
prioritising their significance to our business and brands.
We believe that certification is one of the vital ways to
drive positive change in agricultural supply chains. We
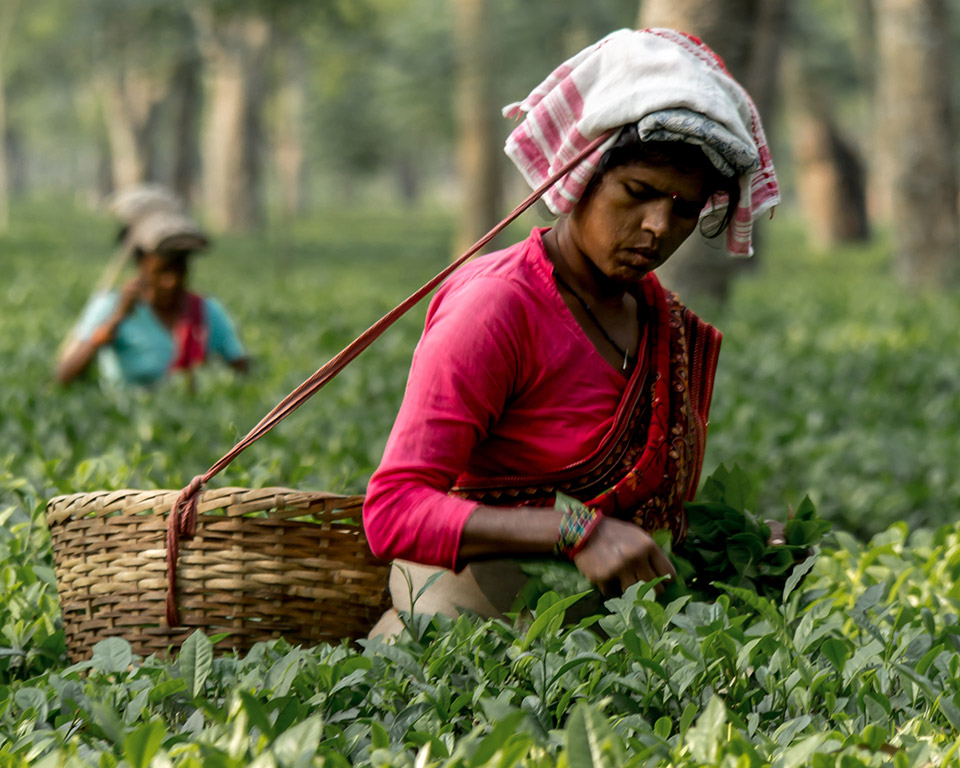
are India’s largest tea business and a founding member
of Trustea (Link), the Indian tea
industry collaboration on sustainability.
The RPP and Sustainable Agriculture Code and
Regenerative Agriculture Principles (RAPs) are hosted on
our website at Link
and Link respectively.
Founding member of Trustea
EI-2. B. If yes, what percentage of inputs were sourced sustainably?
48.1%* of key crops were sourced sustainably.
These crops include tea, palm oil, paper and board,
cereal, sugar, dairy, cocoa, coconut oil, soy, starches, and
vegetables & herbs, comprising more than two-third of
our agricultural raw material volumes. Through focused
programmes, we have achieved sustainable sourcing
for 94% of our total paper and board, 81% of our total
tomatoes and 79% of our total tea procured during the
calendar year 2023.
81%
Sustainable sourcing of tomatoes

79%
Sustainable sourcing of tea

94%
Sustainable sourcing of paper and board

* This indicator is for Calendar Year 2023 which consists of percentage of inputs sourced sustainably for 12 key crops.
EI-3. Describe the processes in place to safely reclaim your products for reusing, recycling and disposing at the end of life, for (a) Plastics (including packaging) (b) E-waste (c) Hazardous waste and (d) other waste.
There are mainly two
categories of material that are reclaimed:
(a) Damaged and expired
finished goods: There is
a comprehensive standard operating procedure
(SOP) for safely handling and disposing of expired/
damaged stocks returned from the market and
depots. These goods are either safely disposed of or
recycled or reused.
(b) Plastic waste as part of Extended Producer
Responsibility (EPR): We follow the new national
EPR Framework notified by CPCB that has become
operational since April 2023 wherein an EPR
wallet credit system has been created by CPCB.
We undertake EPR credit purchases based on our
plastic footprint/consumption and fully meet the
EPR obligation.
EI-4. Whether Extended Producer Responsibility (EPR) is applicable to the entity's activities (Yes/No). If yes, whether the waste collection plan is in line with the Extended Producer Responsibility (EPR) plan submitted to Pollution Control Boards? If not, provide steps taken to address the same.
Yes, Extended Producer Responsibility (EPR) is applicable to HUL, and we comply with the prevailing EPR rules and regulations. Our waste collection plan aligns with the EPR guidelines and the plan submitted to the Central Pollution Control Board (CPCB). W.e.f. FY 2023-24, we have been registered on the CPCB online portal dedicated to EPR Credit exchange and ensure timely submissions of our plastic footprint and corresponding EPR credits purchased.
Leadership Indicators
LI-1. Has the entity conducted Life Cycle Perspective/Assessments (LCA) for any of its products (for manufacturing industry) or for its services (for service industry)? If yes, provide details in the following format?
Life Cycle Assessments (LCA) on our products are
conducted by our Parent Company i.e. Unilever plc,
either internally with in-house LCA experts or with
the help of external partners and in compliance with
ISO 14040. Unilever applies internationally accepted
impact assessment methods, such as the harmonised
life cycle impact assessment method (ReCiPe) and
the European International Reference Life Cycle Data
System (ILCD 2011) midpoint methods for studying the
environmental impacts of a product – from the sourcing
of raw materials to product manufacture, distribution,
consumer use and safe disposal.
Unilever conducts an annual simplified LCA exercise on
representative products across 14 countries, including
India. The methodology is consistent with ISO 14040 and
was recognised by the UNEP as one of the finest examples
of an organisational LCA.
In 2022, we used a simplified LCA to map the carbon
footprint of our products. The analysis was conducted
to understand the key challenges to achieve Net Zero
emissions for all our products from sourcing to point of
sale. A key area of focus was the raw material footprint
(Scope 3 emissions – purchased goods), which is related to
the emissions from our suppliers and their corresponding
feedstocks. We have also included the impact of
packaging, inbound and outbound logistics (including retail-related emissions) and disposal of the products
(post-consumer use, i.e., biodegradation of chemicals and
incineration of plastic packaging).
Unilever is co-funding a second LCA on sustainable palm
oil and the World Foods Life Cycle Database Initiative.
Unilever is a sponsor of the United Nations Environment
Programme (UNEP) Life Cycle Initiative (LCI), which aims
to support the application of LCA for policymaking and
decision-making.
| Name of Product/Service | All major brands across Home Care, Beauty and Personal Care, Foods and Refreshments |
| % of total Turnover contributed | Majority of HUL Turnover is covered |
|---|---|
| Boundary for which the Life Cycle Perspective/ Assessment was conducted | Simplified LCA was conducted to map GHG emissions covering all raw material inputs up to the final disposal phase |
| Whether conducted by independent external agency (Yes/No) | Assessment was conducted by internal agency (Safety and Environment Assurance Centre) |
| Results communicated in public domain (Yes/No). If yes, provide the web-link | Results are currently not communicated in the public domain |
LI-2. If there are any significant social or environmental concerns and/or risks arising from production or disposal of your products/services, as identified in the Life Cycle Perspective/Assessments (LCA) or through any other means, briefly describe the same along-with action taken to mitigate the same.
We have conducted a detailed analysis to identify inherent
ESG risks for our business, considering issues significant
to our stakeholders. And the key risks identified, inter
alia, are climate change, water management, packaging
and waste, and sustainable sourcing. Our Life Cycle
Assessments have highlighted Scope 3 emissions as a
notable factor in our overall emissions footprint.
Raw material sourcing and production represents a
significant contribution to the total life cycle impact of
our products. The GHG emissions from the production of
our key forest-risk commodities (i.e. palm oil, paper and
board, tea, soy and cocoa) arise from land use change (e.g.
deforestation), agricultural practices and downstream
processing and hence our focus is on using non-deforestation materials – including in the case of palm, for
example, NDP (No deforestation, no use of peat land).
In our Home Care business, we are committed to reducing
our virgin fossil-based ingredients in our formulations by
using renewable and recycled carbon sources. We are
working closely with our strategic suppliers and bringing
pathbreaking innovations through our Small and Medium
Enterprises ecosystem. For example, we partnered with
Tuticorin Alkali Chemicals and Fertilisers Limited (TFL)
and Carbon Clean Solutions Limited (CCSL) who have
developed cutting-edge technologies to capture the CO2
from the use of energy in their production processes and turn it into a type of soda ash which is significantly low
in its GHG impact compared to normally produced soda
ash/Sodium Carbonate. Soda ash is a key ingredient in our
detergent products like Rin, Wheel, Surf and Vim.
We are working on creating industry consent on ‘Biomass
to Chemicals’ and ‘CCU’ as two major focus areas along
with already emphasised ‘sustainable energy’ for
decarbonising the chemical industry. In August 2023, we
hosted the ‘Clean Future Summit’ in our effort to mobilise
our partners and take collective action towards net
zero emissions.
Clean Future
Summit
to mobilise our partners and take collection action towards net zero emissions
Sustainable palm
Soap bars comprising more than 80% soap molecules (>70%
TFM – Total Fatty Matter) account for a large part of the
palm footprint in non-edible usage. Ensuring availability
and managing the environmental impacts of increased oil
consumption are challenges faced by the soap industry
today. Our R&D is committed to and has developed novel
and proprietary technologies to manufacture soap bars
that meet the desired functionality, while reducing the
palm footprint significantly, and helping address climate change through lowering greenhouse gas emissions
and the carbon footprint of our products. Further, from a
consumer point of view, these products allow for better
affordability and sensory properties, which are desired
by consumers. Today, soap bar manufacturers mainly use
palm oil as the source of fatty acids, and these are grown in
Southeast Asia, Central & West Africa, and Central America.
Palm oil plantations are under increasing scrutiny for
their effects on the environment, including deforestation,
leading to loss of carbon-sequestration, biodiverse forest
land as well as use of peat land for cultivation releasing
large quantities of GHG into the atmosphere. There
is also concern over the displacement and disruption
of human & animal populations and exploitation of
indigenous populations due to palm oil cultivation.
In 2024, Unilever will target to both move to 100% NDP (No
deforestation, no peat land use) Palm and also reduce
the palm oil usage in its soap bars thereby affording a
significant sustainability and positive consumer impact.
Water
With regard to the use of water in the life cycle of our
products, the consumer use phase represents the majority
of our product’s water footprint (i.e., detergent products).
Our product innovations include the launch of detergent
products (e.g, Surf excel Quick wash powder) that are
designed to address the quantum of water requirement
in the consumer use phase. The breakthrough product
technology allows automatic foam reduction during the
rinse stage of the handwashing process, thereby reducing
the amount of water required for rinsing.
Plastic Circularity
Plastic packaging needs to be recycled in environmentally
friendly ways to build a circular economy. Therefore, we
have set ambitious targets to ramp up the use of recycled
plastic and only use reusable, recyclable or compostable
plastic packaging
(Link).
We were one of the first
companies to achieve Plastic neutrality in 2021 collecting
and responsibly processing more plastic than we used
in packaging the products. We are also committed
to fulfilling our EPR obligation as per Government
regulations. We currently use post-consumer recycled
(PCR) plastic in the packaging for many of our brands
(e.g., Surf excel, Comfort, Vim Dishwash Liquid, etc.), have
moved into 100% technically recyclable plastic for our
sachets and soap bars, and have eliminated plastic from
all our soap cartons. Currently, we use 80% PCR in blister
domes used in Pepsodent toothbrush, 50% PCR in shrink
film for bundling, 50% PCR in Axe talc & Rexona men roll-on
and likewise majority of PCR in many of our categories.
LI-3. Percentage of recycled or reused input material to total material (by value) used in production (for manufacturing industry) or providing services (for service industry).
Plastic packaging needs to be recycled in environmentally friendly ways to build a circular economy. We have set ambitious targets to ramp up the use of recycled plastic and only use reusable, recyclable or compostable plastic packaging (Link).
| Indicate input material | Recycled or re-used input material to total material | |
|---|---|---|
| FY 2023-24 | FY 2022-23 | |
| Plastic packaging | 4.4%* | 2.9%* |
* % of recycled plastic as post-consumer recycled plastic procured on a base of total plastic footprint in the finished goods sold during the financial year.
LI-4. Of the products and packaging reclaimed at end of life of products, amount (in metric tonnes) reused, recycled, and safely disposed, as per the following format:
| Product | FY 2023-24 | FY 2022-23 | ||||
|---|---|---|---|---|---|---|
| Re-used | Recycled | Safely disposed | Re-used | Recycled | Safely disposed | |
| Plastics (including packaging) (MT)* | - | - | 88,294** | - | - | 1,12,802** |
| E-waste | - | - | - | - | - | - |
| Hazardous waste | - | - | - | - | - | - |
| Other waste - Expired and damaged products (MT) | 1,909 | 539 | 6,352 | - | 207 | 9,288 |
* Since April 2023, EPR for Plastics is carried out by purchase of EPR credits from Plastic Waste Processors (PWPs) via portal maintained by Central
Pollution Control Board (CPCB), in line with applicable guidelines. HUL is not collecting any branded plastic waste directly. On-ground plastic waste
collection & disposal is carried out by PWPs authorised & monitored by CPCB/ State Pollution Control Board (SPCB).
** A part of the safely disposed plastic is also recycled, however, due to practical difficulties in traceability of such recycled plastics, the entire
quantum is reported as safely disposed.
LI-5. Reclaimed products and their packaging materials (as percentage of products sold) for each product category.
| S. No. | Indicate product category | Reclaimed products and their packaging materials as % of total products sold in respective category |
|---|---|---|
| 1. | Expired and damaged products (Depot and Market Return) | 0.2% |
| 2. | Plastic waste | 72.2% of total plastic packaging material* |
* In addition to the significant 88,294 tons of actual credit receipts highlighted in LI-4, constituting 72.2% of our total plastic packaging material, we proactively sought additional EPR credits during Jan-Mar’24 to meet the EPR commitment of buying credits equal to 100% of plastics used in our products. Despite encountering a temporary system glitch on CPCB’s EPR portal, we maintained our commitment to environmental responsibility by placing orders for these credits. The purchase orders for these additional credits have been extended, and we anticipate securing the corresponding credits once the portal is fully operational, ensuring seamless compliance with our EPR obligations.