Principle 6
Businesses Should Respect And Make Efforts To Protect And Restore The Environment*
BRSR REPORT
Climate change is a critical business priority and central to building long-term resilience. We recognise climate change as both a systemic risk and an opportunity to transform how we operate, innovate, and grow.
Our approach focuses on accelerating decarbonisation across operations while driving broader ecosystem change through partnerships and industry collaboration. We are advancing renewable energy adoption, improving resource efficiency, and reformulating products with loweremission ingredients supported by science and innovation.
By working closely with suppliers and scaling material transitions, we are reducing our environmental footprint while enabling systemic change towards a low-carbon future.
Message from Our LeadershipMessage from
Our Leadership

Our commitment to responsible business practices is reflected in a supply chain strategy anchored in environmental stewardship and operational sustainability. We are advancing circularity by minimising waste and promoting sustainable sourcing across the value chain. In parallel, we are embedding sustainability into supplier engagement, manufacturing, leveraging technology to enhance transparency, traceability, and resource efficiency. Through these initiatives, we aim to build a resilient, lowcarbon supply chain that drives long-term value creation, aligned with our ESG strategy.


- Platinum-AWS Certification Hosur HUL factory.
 Platinum-AWSCertification Hosur HUL factory
 - LEED Platinum Certification HUL Mumbai Headquarters.
 LEED PlatinumCertification HUL Mumbai Headquarters
 - 21% of reduction in scope 1 emissions from previous year.
 0%Reduction in Scope 1 emissions from previous year
 - ZERO Scope 2 emissions (net).
 ZEROScope 2 emissions (net)
*At HUL, we have a robust process to capture environment data across our manufacturing sites and offices, which is the basis for the numbers reported in Principle 6
The Purchasing Power Parity (PPP) conversion rate used in intensity ratio calculations across Principle 6 is 20.34 for FY 2025-26
ESSENTIAL INDICATORS
At HUL we have been continuously working towards reducing the environmental impact across our operations. Refer to our ‘Climate Action’ page to know more about our key initiatives: https://www.hul.co.in/sustainability/climate/
| Parameter | FY 2025-26 | FY 2024-25 |
|---|---|---|
| From renewable sources | ||
| Total electricity consumption – Gigajoules (A) * | 11,87,953 | 12,25,671 |
| Total fuel consumption – Gigajoules (B) | 23,72,279 | 22,19,234 |
| Energy consumption through other sources – Gigajoules (C) | - | - |
| Total energy consumed from renewable sources – Gigajoules (A+B+C) | 35,60,232 | 34,44,905 |
| From non-renewable sources | ||
| Total electricity consumption (D) | - | - |
| Total fuel consumption (E) | 91,122 | 1,02,998 |
| Energy consumption through other sources (F) | - | 4,131 |
| Total energy consumed from non-renewable sources (D+E+F) | 91,122 | 1,07,129 |
| Total energy consumed (A+B+C+D+E+F) | 36,51,354 | 35,52,034 |
| Energy intensity per rupee of turnover (Total energy consumed/revenue from operations) | 57.5 GJ/crore | 57.7 GJ/crore |
| Energy intensity per rupee of turnover adjusted for Purchasing Power Parity (PPP) (Total energy consumed/revenue from operations adjusted for PPP) | 1,170 GJ / $crore | 1,193 GJ / $crore |
| Energy intensity in terms of physical output | 1.09 GJ/tonne | 1.10 GJ/tonne |
*Sources of renewable electricity include solar energy, wind energy and offsets through International Renewable Energy Certificates (IREC) purchased for grid electricity.
EI-1. Indicate if any independent assessment/evaluation/assurance has been carried out by an external agency (yes/no)? If yes, name of the external agency.
Yes, reasonable assurance has been conducted by M/s B S R & Co. LLP, Chartered Accountants.
Not applicable, as we are not an energy-intensive industry as outlined under the Performance, Achieve and Trade (PAT) scheme of the Government of India.
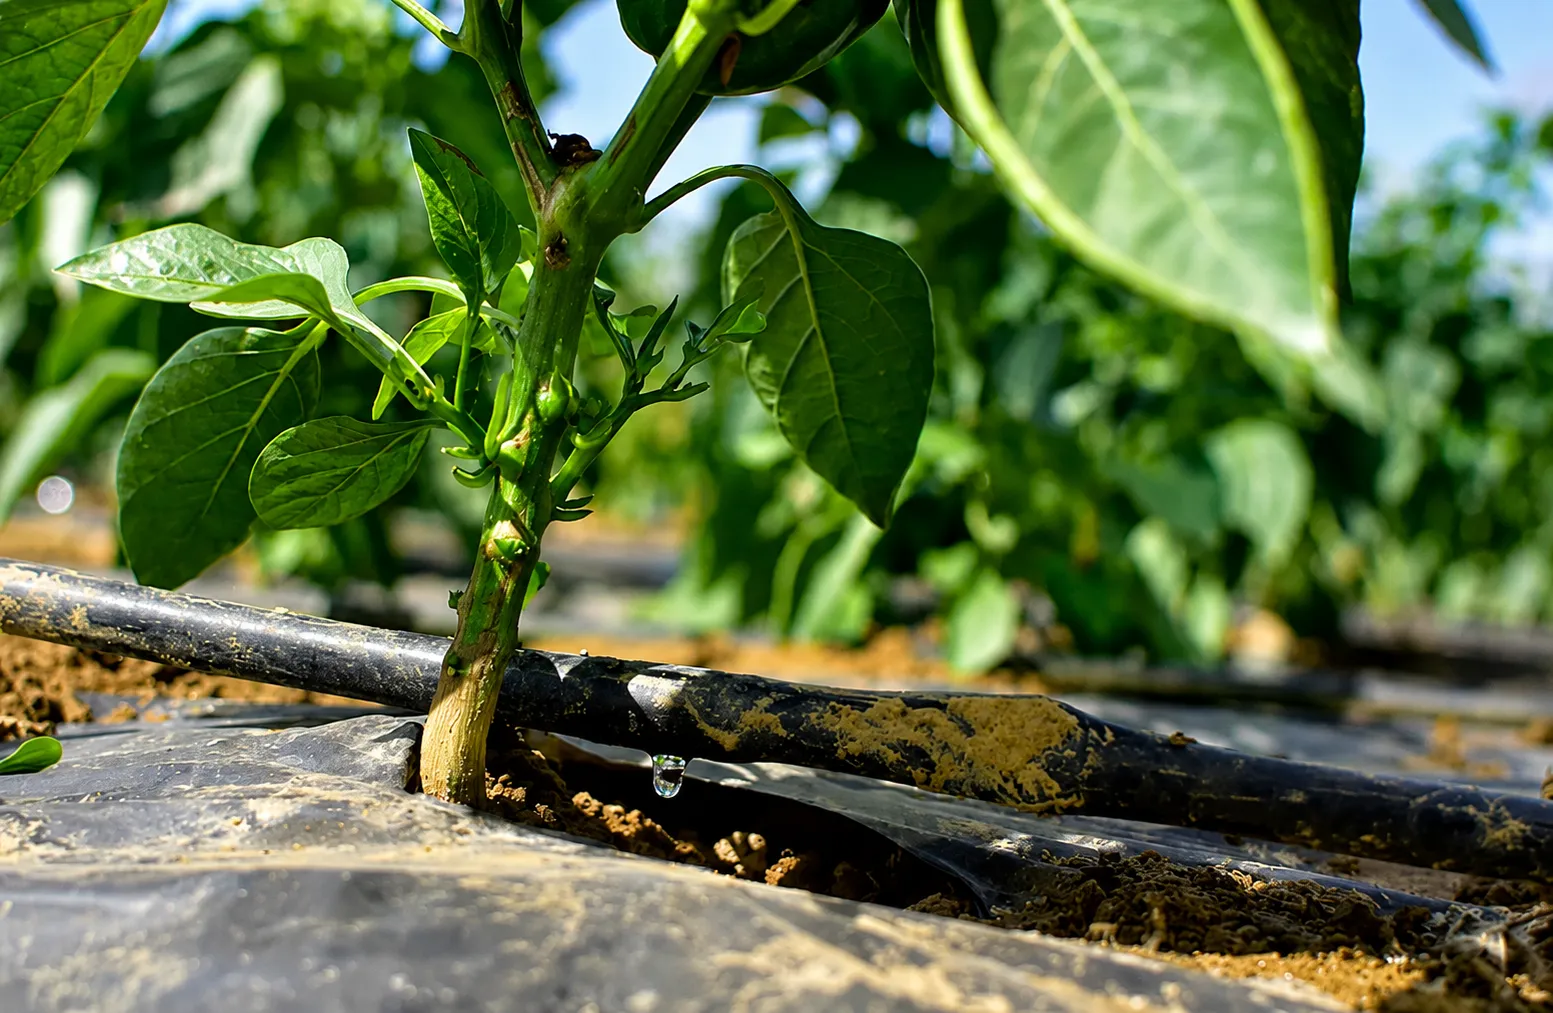
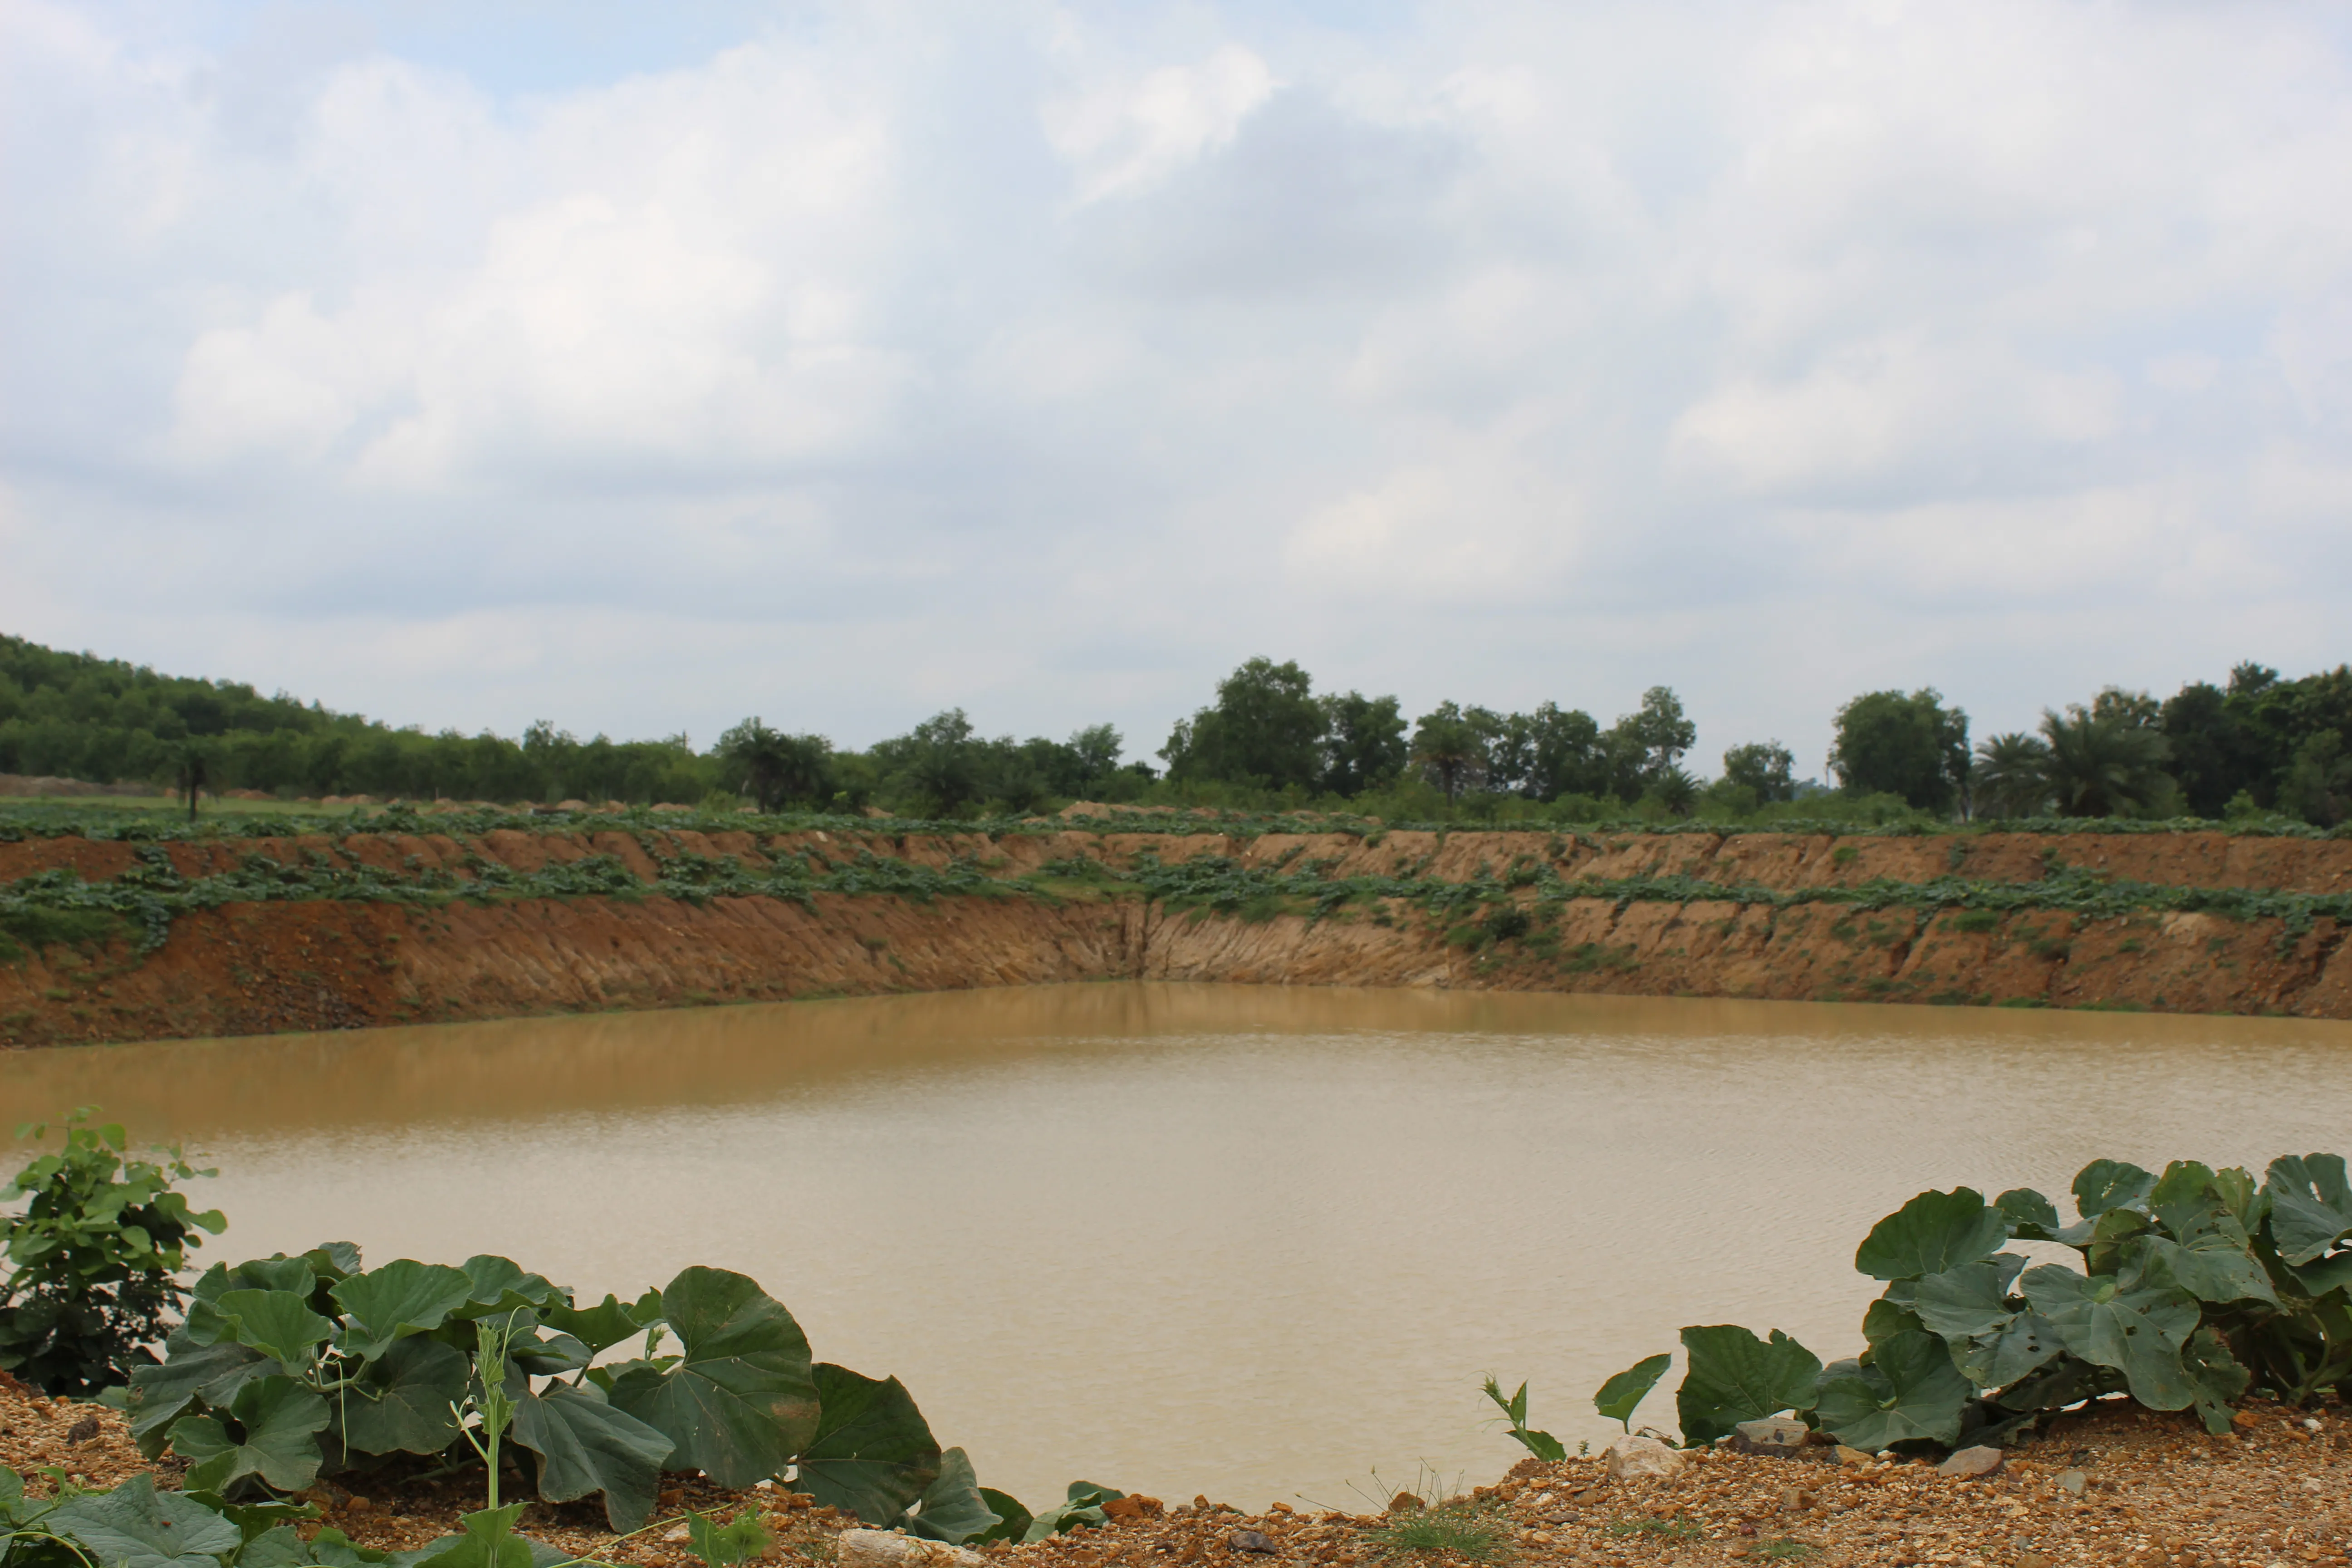
We are addressing water scarcity through conservation, restoration, recharge, and reuse of water. At our manufacturing sites, we have reduced our water usage by 58% compared to the 2008 baseline. This has been achieved through systematic reduction of freshwater abstraction, extensive rainwater harvesting, and maximisation of reuse through RO-based recovery systems. Sites have implemented process optimisation, condensate recovery, automation, leakage reduction, and recycling initiatives, resulting in improved operational efficiencies, reduced water-related risks, and stronger regulatory and community relationships. We have also embarked on a journey to align our Water Stewardship Programme to the Alliance for Water Stewardship (AWS) standard. AWS is a global membership bringing together businesses, NGOs, and the public sector. In the International Water Stewardship Standard, members uphold local water-resource sustainability through their adoption and promotion of a universal framework, this standardizes good water stewardship practices, driving recognition and rewarding performance. In FY 2025-26, Hosur and Chhindwara factories achieved Platinum-level AWS Certification, reflecting strong site leadership, governance, and execution in water stewardship.
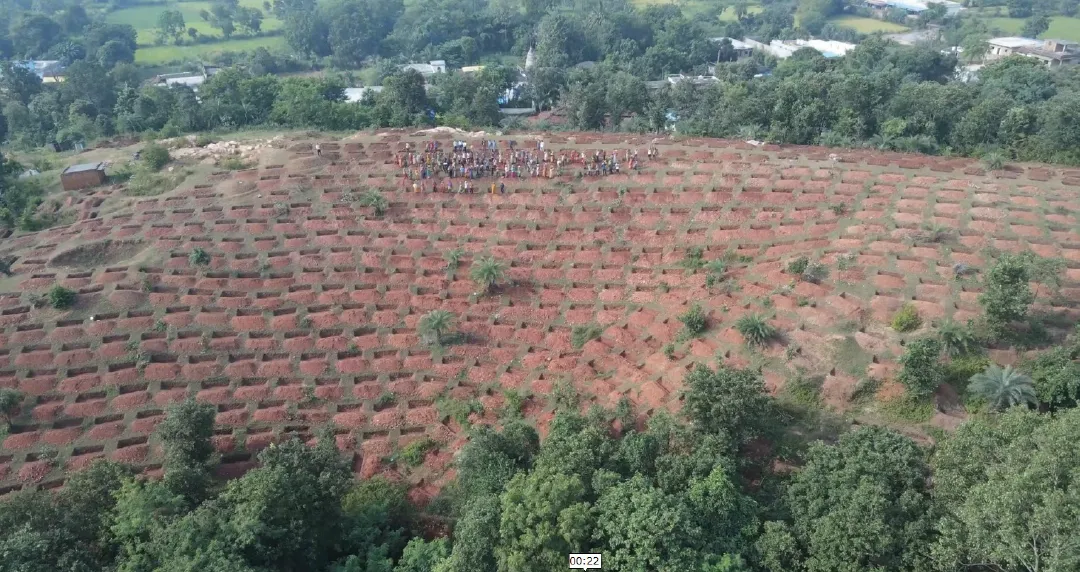
At the community level, we have implemented Water Stewardship Projects across 15 water-stressed factory locations (as per the World Resources Institute) in India through Prabhat, our sustainable community development CSR programme. Aligning the interventions to the global Alliance for Water Stewardship framework, focus is laid on creating sustainable water balance, water quality, good water governance, development & maintenance of important water resources & WASH. This holistic approach to water as a resource, addresses a multitude of issues at the community level. Prabhat drives water stewardship programme in 60 villages around factories and has achieved over 12 billion litres savings potential, 54 billion litres of water recharge potential.
HUL set up the Hindustan Unilever Foundation (HUF) in 2010 to support and amplify scalable solutions that can help address India’s water challenges - specifically for rural communities that intersect with agriculture. HUF established its ‘Water for Public Good’ programme, which is anchored in the belief that water is a common good and must be governed by citizen communities. The aim was to catalyse effective solutions to India’s water challenges involving the government, communities, experts, and mission-based organisations. HUF’s supported programs have reached over 19,000 villages since inception and have enabled creation of a cumulative and collective water potential of over 4.5 trillion litres* since its inception.
| Parameter | FY 2025-26 | FY 2024-25 |
|---|---|---|
| Water withdrawal by source (in kilolitres) | ||
| (i) Surface water | - | 200 |
| (ii) Groundwater | 21,04,579 | 20,24,990 |
| (iii) Third party water | 7,64,928 | 8,11,232 |
| (iv) Seawater/desalinated water | - | - |
| (v) Others (Rain Water) | 71,629 | 71,299 |
| Total volume of water withdrawal (in kilolitres) (i + ii + iii + iv + v) | 29,41,136 | 29,07,721 |
| Total volume of water consumption (in kilolitres) | 29,08,019 | 28,77,728 |
| Water intensity per rupee of turnover (Water consumed/turnover in rupees) | 45.8 KL/crore | 46.8 KL/crore |
| Water intensity per rupee of turnover adjusted for Purchasing Power Parity (PPP) (Total water consumption/revenue from operations adjusted for PPP) | 932 KL / $crore | 966 KL / $crore |
| Water intensity in terms of physical output | 0.87 KL/tonne | 0.89 KL/tonne |
*Assured by an independent external firm
EI-3. Indicate if any independent assessment/evaluation/assurance has been carried out by an external agency (yes/no)? If yes, name of the external agency
Yes, reasonable assurance has been conducted by M/s B S R & Co. LLP, Chartered Accountants.
| Parameter | FY 2025-26 | FY 2024-25 |
|---|---|---|
| Water discharge by destination and level of treatment (in kilolitres)* | ||
| (i) To surface water | ||
| - No treatment | - | - |
| - With treatment | - | - |
| (ii) To groundwater | ||
| - No treatment | - | - |
| - With treatment | - | - |
| (iii) To seawater | ||
| - No treatment | - | - |
| - With treatment | - | - |
| (iv) Sent to third-parties | ||
| - No treatment | - | - |
| - With treatment (secondary treatment) | 33,117 | 29,993 |
| (v) Others | ||
| - No treatment | - | - |
| - With treatment | - | - |
| Total water discharged (in kilolitres) | 33,117 | 29,993 |
*Water discharge has been reported for owned manufacturing sites
EI-4. Indicate if any independent assessment/evaluation/assurance has been carried out by an external agency (yes/no)? If yes, name of the external agency
Yes, reasonable assurance has been conducted by M/s B S R & Co. LLP, Chartered Accountants.
We focus on maximising recycling and reusing treated wastewater on-site, effectively reducing the need for freshwater intake. As of 31st March 2026, 23 out of 25 of our factories are Zero Liquid Discharge, i.e. they recycle and reuse 100% of their wastewater within the site. Such recycled water is used in cooling towers, as a boiler feed, in fire tanks, external area cleaning, toilet flushing, and gardening. The remaining two factories discharge water in common effluent treatment plants (CETP)/municipal drainages as per the consent to operate conditions issued by the Pollution Control Board.
| Parameter* | Please specify unit | FY 2025-26 | FY 2024-25 |
|---|---|---|---|
| NOx | MT | 292 | 278 |
| SOx | MT | 135 | 132 |
| Particulate matter (PM) | MT | 299 | 278 |
| Persistent organic pollutants (POP) | MT | - | - |
| Volatile organic compounds (VOC) | MT | 618 | 574 |
| Hazardous air pollutants (HAP) | MT | - | - |
* Pollutants are calculated using the IPCC/EMEP/EEA Guidebook 2023 factors for NOx, SOx, PM, and VOC. HAP & POP have been updated to zero based on emission test reports.
EI- 6. Indicate if any independent assessment/evaluation/assurance has been carried out by an external agency (yes/no)? If yes, name of the external agency.
Yes, an independent assurance has been conducted by M/s B S R & Co. LLP, Chartered Accountants.
To reduce our carbon footprint, we are investing in new technologies, switching to renewable sources, and innovating to transform our factory operations. Refer to our https://www.hul.co.in/sustainability/climate/
| Parameter | Unit | FY 2025-26 | FY 2024-25 |
|---|---|---|---|
| Total Scope 1 emissions | tCO2e | 7,054 | 8,944 |
| Total Scope 2 emissions | tCO2e | Gross: 2,31,262Net: 0** | Gross: 2,23,923Net: 0 |
| Total Scope 1 and Scope 2 emissions* | tCO2e | 7,054 | 8,944 |
| Total Scope 1 and Scope 2 emissions per rupee of turnover | tCO2e / ₹ crore | 0.11 | 0.15 |
| Total Scope 1 and Scope 2 emission intensity per rupee of turnover adjusted for Purchasing Power Parity (PPP) | tCO2e / $crore | 2.3 | 3.0 |
| Total Scope 1 and Scope 2 emission intensity in terms of physical output | tCO2e /tonne | 0.002 | 0.003 |
*We report our emissions with reference to the latest Greenhouse Gas Protocol Corporate Accounting and Reporting Standard (GHG Protocol). Energy conversion and emission factors are used as per the UN’s Intergovernmental Panel on Climate Change (IPCC)
**The above numbers are after deducting the International Renewable Energy Certificates (IREC) purchased for grid electricity
EI-7. Indicate if any independent assessment/evaluation/assurance has been carried out by an external agency (yes/no)? If yes, name of the external agency
Yes, reasonable assurance has been conducted by M/s B S R & Co. LLP, Chartered Accountants.
We are committed to using better and less to support our goal of achieving zero emissions in our own operations.
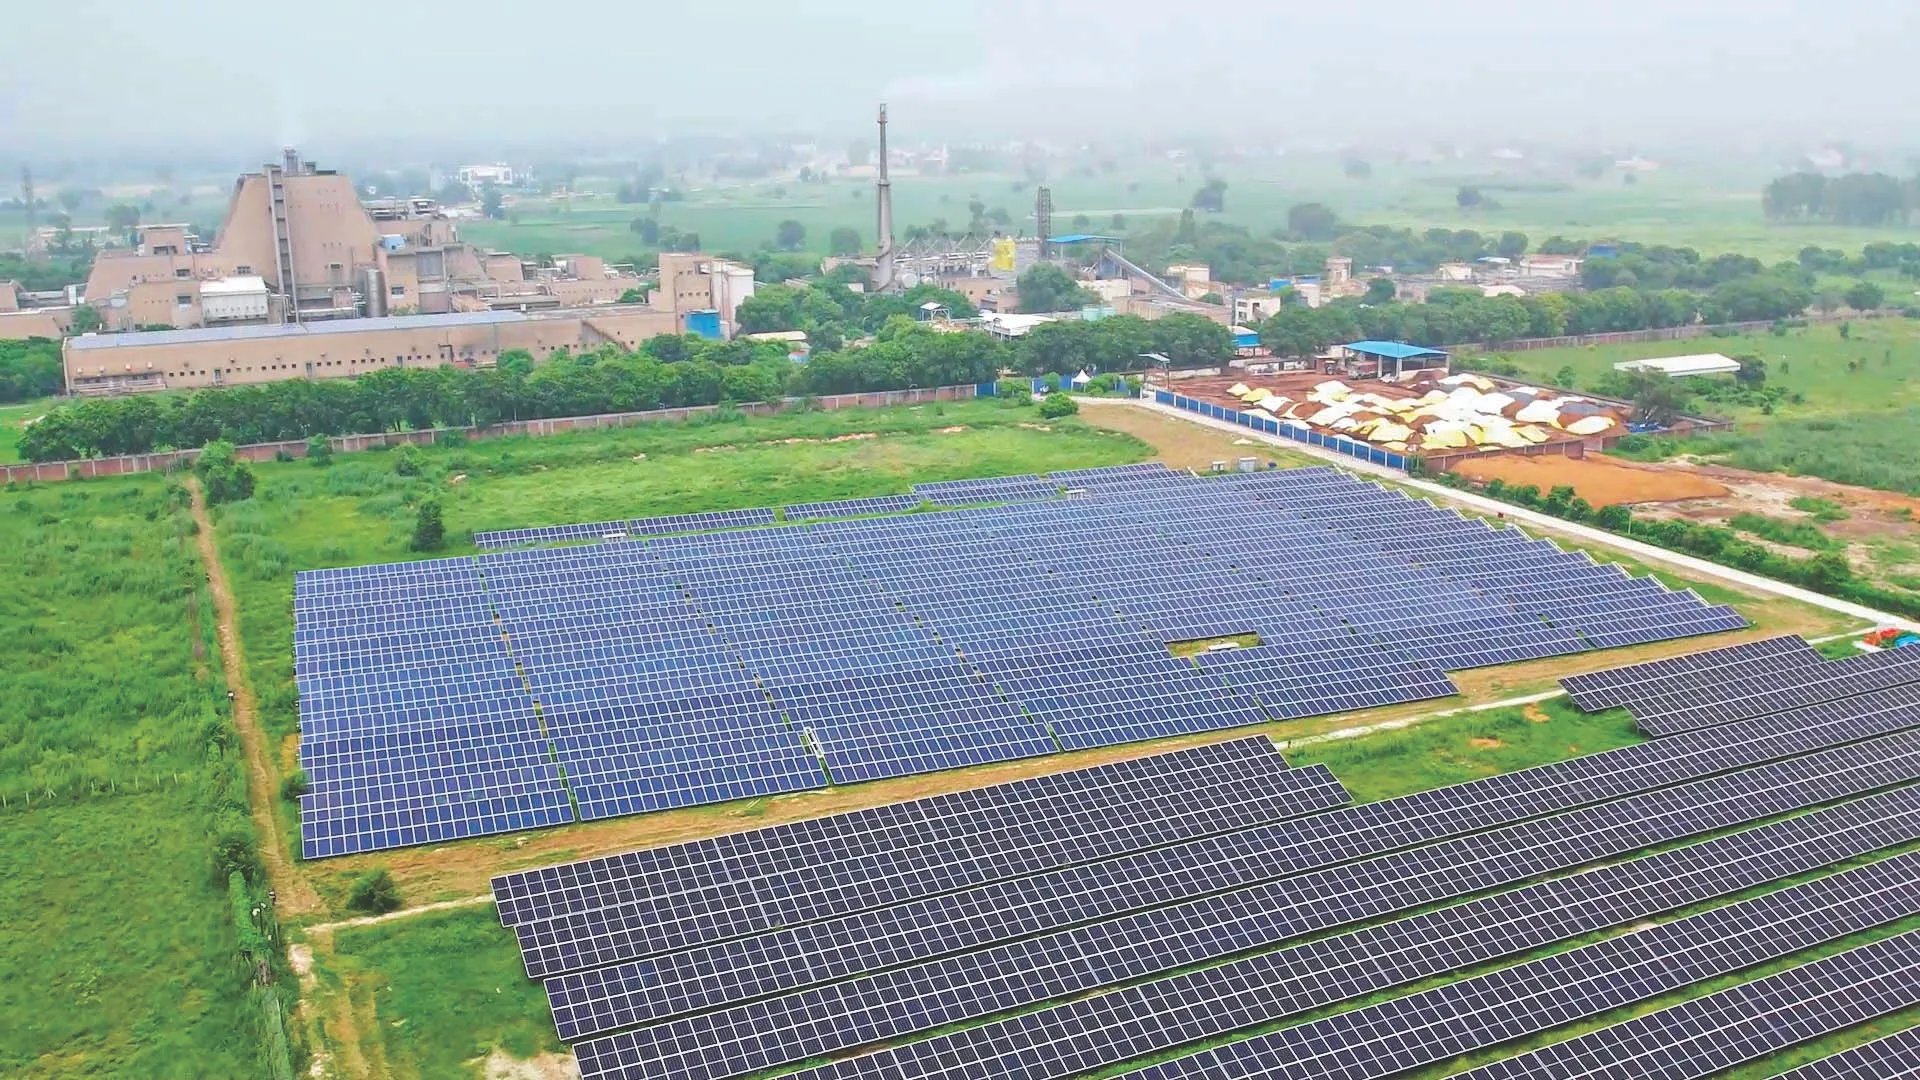
Transition to Renewable Energy: We have started purchasing renewable energy through onsite solar power plants and invested in offsite windmills to reduce our reliance on grid power. Additionally, we have invested in a group captive solar power plant with a 45MW capacity, in partnership with Brookfield, to meet the daytime energy requirements of all our factories in India.
Substitution of Fossil Fuels: We have eliminated coal from our operations and replaced it with green fuels. Biomass has been introduced instead of coal, and biofuel is used instead of furnace oil and high-speed diesel (HSD). As of March 2026, 97% of our energy (both electrical and thermal) comes from renewable sources. All our electricity is sourced from renewable energy, including solar, wind, and IREC green certification. Additionally, 16 out of our 25 sites now meet Unilever’s internal criteria for RE100.
Energy Efficiency: We have implemented various energy-saving projects, such as heat pumps, magnetic chillers, energy-efficient motors, variable voltage and frequency drives (VVFD), thermic fluid heaters, and energy-efficient air handling units (AHUs) to reduce overall energy consumption in our factories. We have significantly reduced our per tonne GHG emissions and energy consumption by 49% in FY 2025-26 compared to the 2008 baseline.
Our Climate Transition Action Plan outlines our strategy to achieve near-term value chain emission reduction targets, focusing on nine priority action areas: Supplier Climate Programme, product reformulation, forest-risk commodities, regenerative agriculture, chemical ingredients, packaging and logistics.
We have spent many years reducing waste and recycling in our operations, and we continue to look for innovative ways to eliminate and extract value from our waste streams. We continue to maintain our standard to send zero non-hazardous waste to landfill from our factories.
| Parameter | FY 2025-26 | FY 2024-25 |
|---|---|---|
| Total waste generated (in metric tonnes) | ||
| Plastic waste (A) | 13,382 | 12,531 |
| E-waste (B) | 81 | 51 |
| Bio-medical waste (C) | 16 | 14 |
| Construction and demolition waste (D)* | 9,065 | 4,013 |
| Battery waste (E) | 12 | 26 |
| Radioactive waste (F) | - | - |
| Other hazardous waste (G)** | 1,006 | 638 |
| Other non-hazardous waste generated (H) | 88,122 | 73,704 |
| Total (A + B + C + D + E + F + G + H) | 1,11,684 | 90,977 |
| Waste intensity per rupee of turnover (Total waste generated/Revenue from operations) | 1.8 MT/crore | 1.5 MT/crore |
| Waste intensity per rupee of turnover adjusted for Purchasing Power Parity (PPP) | 35.8 MT / $crore | 30.6 MT / $crore |
| Waste intensity in terms of physical output | 0.03 MT/tonne | 0.03 MT/tonne |
| For each category of waste generated, total waste recovered through recycling-using or other recovery operations (in metric tonnes) | ||
| Category of waste | ||
| (i) Recycled | 67,920 | 53,338 |
| (ii) Re-used | 39,644 | 35,269 |
| (iii) Other recovery operations# | 3,296 | 1,871 |
| Total | 1,10,860 | 90,478 |
| For each category of waste generated, total waste disposed by nature of disposal method (in metric tonnes) | ||
| Category of waste | ||
| (i) Incineration | 326 | 186 |
| (ii) Landfilling | 498 | 313 |
| (iii) Other disposal operations | - | - |
| Total | 824 | 499 |
*Construction and demolition waste increased during the year due to demolition activities undertaken as part of office/facility refurbishment and new project developments
**Hazardous waste generation increased primarily due to higher waste rejects arising from operational processes involving Multi-Effect Evaporators and associated equipments.
#Hazardous waste is disposed of through Pollution Control Board authorised/licensed vendors in line with Consent to Operate condition.
EI-9. Indicate if any independent assessment/evaluation/assurance has been carried out by an external agency (yes/no)? If yes, name of the external agency.
Yes, reasonable assurance has been conducted by M/s B S R & Co. LLP, Chartered Accountants.
Our zero‑waste approach is based on treating waste as a resource, with priority given to waste reduction, followed by reuse and recycling. Where recycling infrastructure is unavailable, energy recovery is adopted to ensure responsible waste management. This strengthens our circular economy approach, improves factory operations, and reduces environmental impact. All factories have pre‑processing facilities such as source segregation and waste minimisation measures to enhance recyclability.
We continue to eliminate hazardous chemicals from cleaning and disinfection processes through technology upgrades and safer alternatives. In FY 2025–26, all factories maintained zero non‑hazardous waste to landfill status by maximising reuse and recycling. Initiatives include reuse of jumbo bags and cartons, recycling of process waste such as soap, use of sludge as alternative boiler fuel, upcycling of plastic waste, and diversion of food waste for animal feed. Hazardous waste is managed in compliance with the Hazardous and Other Wastes (Management and Transboundary Movement) Rules, 2016 and as per State Pollution Control Board Authorisation conditions.
Our R&D teams continue to reduce waste at source through improved material selection and product design. We increased the use of recycled content in packaging and, under our Extended Producer Responsibility (EPR) commitments, collected and responsibly managed more plastic waste than placed on the market.
As a result, total waste generation in FY 2025–26 reduced by 53% per tonne of production compared to the 2008 baseline, while hazardous waste generation reduced by 67% per tonne of production.
| S. no. | Location of operations/ offices | Type of operations | Whether the conditions of environmental approval/ clearance are being complied with? (Y/N) If no, the reasons thereof and corrective action taken, if any. |
|---|---|---|---|
| 1 | Dapada* | Manufacturing | Yes |
*Notified as an ecologically sensitive area by Dadra & Nagar Haveli Planning and Development Authority in November 2023
| S. no. | Name and brief details of project | EIA Notification No. | Date | Whether conducted by independent external agency (yes/no) | Results communicated in public domain (yes/no) | Relevant web link |
|---|---|---|---|---|---|---|
| Nil | Nil | Nil | Nil | Nil | Nil | Nil |
Yes, during FY 2025–2026, the Company’s operations and offices complied with all applicable environmental laws and regulations and operated in accordance with the Consent to Operate conditions issued by the Central and State Pollution Control Boards. Each site has a dedicated, trained, and qualified Environment, Health, and Safety (EHS) representative responsible for co-ordinating the implementation of the site environmental management system, overseeing environmental performance of activities, facilitating internal coordination on environmental matters, advising line management, and acting as the interface with regulatory authorities and local stakeholders.
| S. no. | Specify the law/regulation/ guidelines which was not complied with | Provide details of the non-compliance | Any fines/penalties/action taken by regulatory agencies such as pollution control boards or by courts | Corrective action taken if any |
|---|---|---|---|---|
| 1 | None | |||
LEADERSHIP INDICATORS
As per the Central Ground Water Authority, the below locations are in water-stressed areas: Chhindwara, Nabha, Rajpura, Sonipat, Pondicherry, Amli, Dapada, and Nashik.
| Parameter | FY 2025-26 | FY 2024-25 |
|---|---|---|
| Water withdrawal by source (in kilolitres) | ||
| (i) Surface water | - | 200 |
| (ii) Groundwater | 10,68,333 | 10,07,973 |
| (iii) Third party water | 2,48,271 | 2,94,769 |
| (iv) Seawater/desalinated water | - | - |
| (v) Others (Rain water) | 32,157 | 29,374 |
| Total volume of water withdrawal (in kilolitres) | 13,48,761 | 13,32,316 |
| Total volume of water consumption (in kilolitres) | 13,48,761 | 13,32,316 |
| Water intensity per rupee of turnover (Water consumed/turnover in rupees) | 21.2 KL/ ₹ crore | 21.7 KL/ ₹ crore |
| Water discharge by destination and level of treatment (in kilolitres) | ||
| (i) Into surface water | ||
| –No treatment | - | - |
| –With treatment | - | - |
| (ii) Into groundwater | ||
| –No treatment | - | - |
| –With treatment | - | - |
| (iii) Into seawater | ||
| –No treatment | - | - |
| –With treatment | - | - |
| (iv) Sent to third-parties | ||
| –No treatment | - | - |
| –With treatment (secondary treatment) | - | - |
| (v) Others | ||
| –No treatment | - | - |
| –With treatment | - | - |
| Total water discharged (in kilolitres) | - | - |
Indicate if any independent assessment/evaluation/assurance has been carried out by an external agency (yes/no)? If yes, name of the external agency.
Yes, an independent assurance has been conducted by M/s B S R & Co. LLP, Chartered Accountants.
Measuring GHG emissions is a significant challenge and relies on many estimates and on information from third parties. We have estimated our Scope 3 emissions across each of the 15 GHG Protocol Scope 3 emission categories relevant to our business. We measure our most material emissions from procured goods and services, using data on real volumes of procured raw materials/packaging and services combined with relevant emissions factors for these materials, applying the latest guidance on the use of emissions factors (IPCC AR6) and the draft GHG Protocol Land Sector guidance. Under the GHG Protocol, indirect consumer use-phase emissions are an optional part of a company’s Scope 3 emissions. Our GHG emissions in scope of our Net Zero by 2039 ambition do not include these optional indirect emissions sources.
| Parameter | Unit | Jan’25 – Dec ’25 | Jan’24 – Dec ’24 |
|---|---|---|---|
| Total Scope 3 emissions in scope of Net zero ambition | Metric tonnes of CO2 Equivalent | 1,05,35,856 | 99,62,535 |
| Total Scope 3 emissions inclusive of indirect consumer use | 1,19,57,114 | 1,13,37,855 | |
| Total Scope 3 emissions per rupee of turnover | tCO2 / ₹ crore | 188.3 | 184.3 |
LI-2. Indicate if any independent assessment/evaluation/assurance has been carried out by an external agency (yes/no) If yes, name of the external agency.
No
We have duly complied with the conditions laid down by the Dadra & Nagar Haveli Planning and Development Authority. During FY 2025-26, there was no significant impact on biodiversity due to our manufacturing operations.
| S. No. | Initiative undertaken | Details of the initiative (web-link, if any, may be provided along-with summary) | Outcome of the initiative |
|---|---|---|---|
| 1 | Water Stewardship | Active water stewardship programmes are implemented across all factories to reduce freshwater use and strengthen resilience to water related risks. At Doom Dooma, rooftop rainwater harvesting with modular filtration enables capture and reuse of nearly 100% rainfall. At Sonipat, reuse, recovery, and leakage reduction initiatives delivered significant savings on an annualised basis. At Etah, automation, condensate reuse, cooling tower optimisation, and rainwater harvesting enabled a 12% reduction in specific water consumption. Further, some of our technology and digital interventions within the factory include the following:-
HUL set up the Hindustan Unilever Foundation (HUF) in 2010 to support and amplify scalable solutions that can help address India’s water challenges - specifically for rural communities that intersect with agriculture. HUF established its ‘Water for Public Good’ programme, which is anchored in the belief that water is a common good and must be governed by citizen communities. The aim was to catalyse effective solutions to India’s water challenges involving the government, communities, experts, and mission-based organisations. HUF’s supported programs have reached over 19,000 villages since inception. At the community level, we have implemented Water Stewardship Projects across 15 water-stressed factory locations (as per the World Resources Institute) in India through Prabhat, our sustainable community development CSR programme. Aligning the interventions to the global Alliance for Water Stewardship framework, focus is laid on creating sustainable water balance, water quality, good water governance, development & maintenance of important water resources & WASH. This holistic approach to water as a resource, addresses a multitude of issues at the community level. Prabhat drives water stewardship programme in 60 villages around factories and has achieved over 12 billion litres savings potential, 54 billion litres of water recharge potential. | Our own manufacturing operations have witnessed a 58% reduction in water usage (cubic meter per tonne of production) in FY 2025-26 as compared to the 2008 baseline. We were able to achieve this by focusing on reducing freshwater abstraction, implementing captive rainwater harvesting, and maximising the use of RO plants. The benefits include increased efficiencies, reduced risks, strengthening stakeholder relationships and building community trust. HUL has been honored with several prestigious external recognitions, including:
HUF along with its partners has created a cumulative and collective water potential of over 4.5 trillion litres*. To underscore the importance of the water potential created by HUF; 4.5 trillion litres of water can meet the drinking water needs of India’s population for nearly three years. |
| 2 | Emissions | We are committed to taking steps to collectively and positively address climate change. We have started purchasing renewable energy through onsite solar power plants and invested in offsite windmills to reduce our reliance on grid power. Additionally, we have invested in a group captive solar power plant with a 45MW capacity, in partnership with Brookfield, to meet the daytime energy requirements of all our factories in India. All our electricity is sourced from renewable energy, including solar, wind, and IREC green certification. We have eliminated coal from our operations and replaced it with green fuels. Biomass has been introduced instead of coal, and biofuel is used instead of furnace oil and high-speed diesel (HSD). Additionally, 16 out of our 25 sites now meet Unilever’s internal criteria for RE100. We have implemented various energy-saving projects, such as heat pumps, magnetic chillers, energy-efficient motors, variable voltage and frequency drives (VVFD), thermic fluid heaters, and energy-efficient air handling units (AHUs), to reduce overall energy consumption in our factories. We have implemented Digital Energy Management System (EMS) and Boiler Hub insights to optimize energy consumption and improve boiler efficiency through advanced digital solutions. Please refer https://www.hul.co.in/sustainability/climate/ for more details | As on March 2026, the renewable energy percentage (for both Electrical and Thermal combined) is 97% for our own manufacturing sites. We have significantly reduced our per tonne GHG emission by 99% and energy consumption by 49% in our own manufacturing operations in FY 2025-26 compared to 2008 baseline. Additionally, HUL has been honoured with several prestigious external recognitions, including:
|
| 3 | Waste | Our factories have identified innovative ways to reuse various non-hazardous waste streams and maintain the status of zero non-hazardous waste to landfills in factories and offices across the Company. This was done by maximising the reuse and recycling of all non-hazardous waste in environmentally friendly ways. We have also taken the initiative to eliminate food waste by commissioning a dewatering screw press and sludge drying beds on-site for dewatering and drying of sludge with an intent to use it as a boiler fuel. Please refer https://www.hul.co.in/sustainability/plastics/ for more details | The total waste generated from the factories was 53% (per tonne of production) lower in our own manufacturing operations in FY 2025-26 than the 2008 baseline. All our factories are equipped with pre-processing facilities, such as waste separation and waste reduction at the source, thus improving recyclability. Additionally, HUL has been honored with several prestigious external recognitions,
|
*Assured by and external independent firm
We have a standardised procedure to maintain business continuity and ensure robust and effective management of incidents. It is based on the principles of prevention, preparedness, response, and recovery. We follow a risk-based approach to identify credible business risks and review the management plan regularly to ensure that it is up-to-date and effective.
We incorporate advanced cyber considerations into our existing Business Continuity Plan to strengthen resilience against cyber threats. This includes conducting regular cybersecurity risk assessments, developing comprehensive incident response plans, enhancing network security, and providing ongoing employee training.
In addition, to safeguard our data and IT systems, we have a Data Recovery Capability Standard for designing, operating and managing any device or technology solution that stores or processes our data. The purpose of this standard is to specify controls to ensure that our data, applications, and systems can be recovered to meet business operational requirements following a disruptive cyber incident.
We have set specific sustainability targets, serving as our strategy to deliver consistent, competitive, profitable, and responsible growth. We have set an ambitious sustainability agenda to tackle the issues that our consumers and stakeholders care deeply about. The details of our mitigation measures can be reviewed on the following websites: https://www.hul.co.in/sustainability/climate/ and https://www.hul.co.in/sustainability/nature/
Our plan to progress towards our near-term value chain emission reduction targets has following priority action areas which include Supplier Climate Programme, reformulating products, forest-risk commodities, regenerative agriculture, chemical ingredients, packaging and logistics.
We conduct periodic risk assessments of our suppliers using country risk and commodity risk data from external third-party risk data providers. As of 31st March 2026, 92.9% of the suppliers (by value of business done) have undergone risk assessment and are compliant.
Our RPP and its Fundamental Principles embody our commitment to responsible, transparent, and sustainable business. Each fundamental principle of the RPP provides guidance on what we expect from responsible and sustainable business partners. We are committed to working with our suppliers on this journey of continuous improvement.
We also verify alignment to and implementation of the RPP’s mandatory requirements using supplier self-declarations, online assessments and independent verification, including third-party audits which are performed for designated high-risk countries and supplier types.
By the listed entity: HUL through its CSR programs under Regenerative Agriculture goal, has started a Verified emission reduction (VER) program. HUL has been doing impactful work through our existing agricultural linked programmes, which ensured significant increase in crop production owing to resilient regenerative and sustainable agricultural practices, leading to increased net income for farmers. VER programme will go one step further and HUL will map and record the carbon footprint reduction through improved agricultural practices clubbed with agro forestry.
By the top ten (in terms of value of purchases and sales, respectively) value chain partners: Not available.